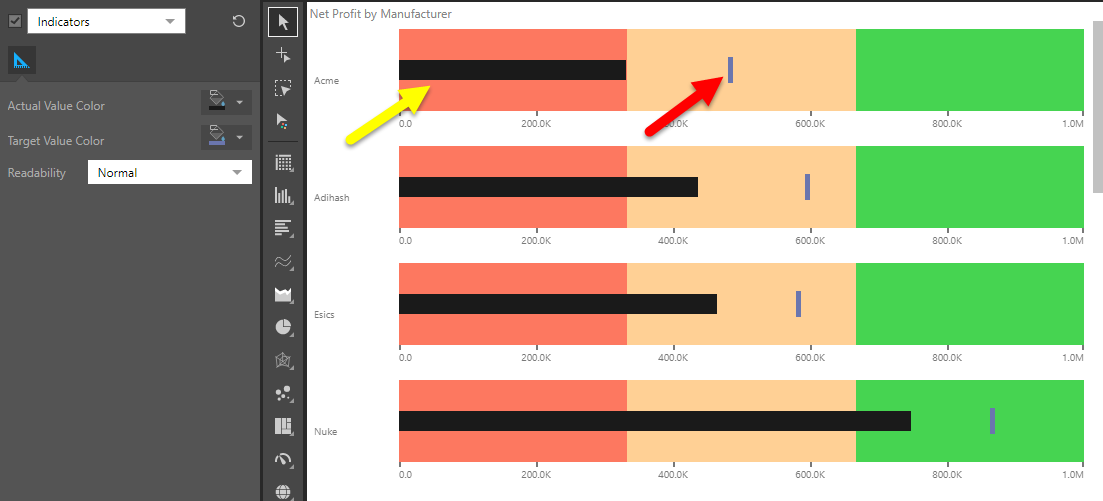
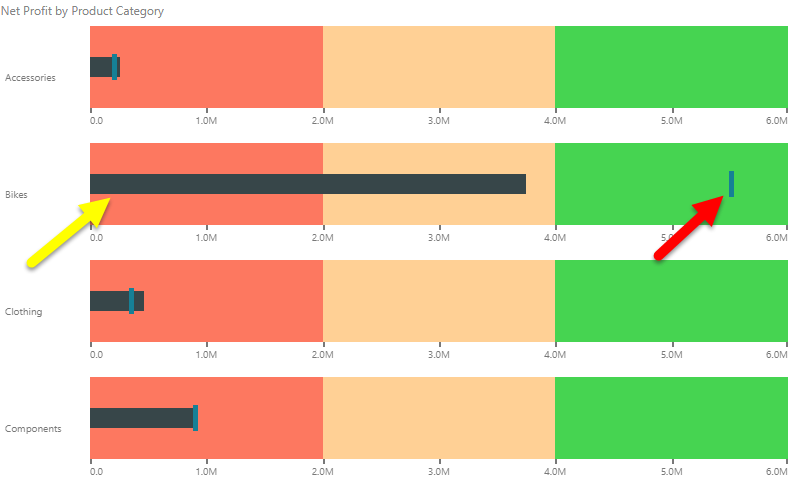
The bullet chart features two indicators that display the actual value and the target value. The actual value is represented by the bar (yellow arrow below), while the target value is represented by the vertical line (red arrow below).
Formatting panel
You can change the indicator colors by selecting Indicators from the main dropdown list:
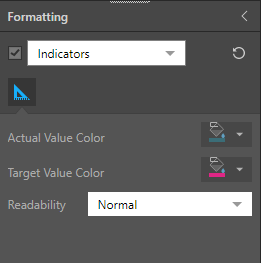
- Actual Value Color: set the color for the bar, which shows the actual value.
- Target Value Color: set the color for the vertical line, which represents the target value.
- Readability: Pyramid's readability logic automatically determines the foreground color in visualizations based on the background color.
In this example, the actual value color was changed to black, and the target value color was changed to purple.